

Glucoscore: The fusion of data science and precision nutrition
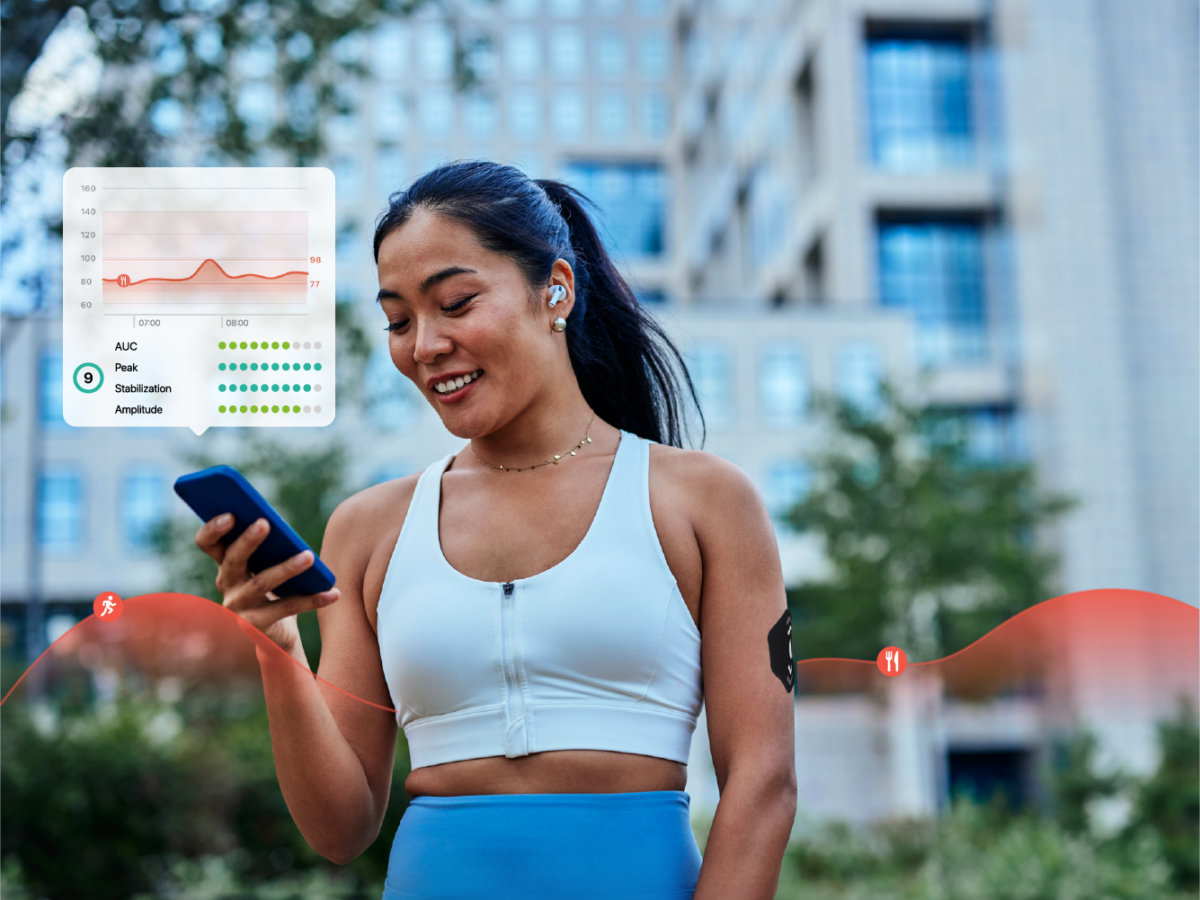
Hello Vibers! Our team at Glucovibes is particularly excited to bring you this post. From the beginning of our blog, we’ve talked about glucose monitoring and its context. After years of learning, thanks to the data collected from our users and advancements in our technology, we can now say we’re one step closer to connecting data science with nutrition. Based on our philosophy that only what can be measured can be improved, we introduce the Glucoscore.
The Glucoscore is the result of the collaborative efforts of Glucovibes’ scientific team, which includes experts from diverse and complementary fields: nutrition, engineering, artificial intelligence, medical sciences, and computer science, among others. With this technology and expertise, we can offer you an assessment of the metabolic impact a meal has on your glucose curve. In other words, we analyze how a meal affects your metabolism using your glucose levels as a comparative baseline. This metric helps you understand your individual data from food intake and how different foods (or combinations of foods) can impact your glucose levels in varying ways.

At Glucovibes, we boast what is likely the largest metabolic database in Europe focused on the lifestyle of healthy individuals. By the end of 2023, we have accumulated over 700,000 hours of glucose monitoring, more than 85,000 recorded meals with their corresponding metabolic impacts, and over 100,000 activities reported in our app. From this vast repository of information, we have selected over 20,000 intake instances to train a machine learning model. This model is designed to classify glucose curves based on the criteria established by our scientific team, drawing from both the available scientific evidence and our experience over the past two years working with thousands of users like you. This analysis has been supervised and labeled by the Glucovibes science and nutrition team, just as all the information used by our artificial intelligence algorithms has been meticulously curated. In other words, we have developed proprietary algorithms that automatically analyze your glucose curves and learn from the extensive knowledge contained in our database.
How is the Glucoscore calculated?
To calculate the Glucoscore, our technology individually analyzes each intake using the glucose data recorded in the app from the time of consumption up to two hours afterward (known as postprandial glucose). In the learning process, four parameters have been used to characterize and classify the glucose curves, which we also provide to you. These parameters represent key characteristics of the impact of the intake on glucose levels:
- Peak
- Amplitude
- Stabilization
- Area Under the Curve (AUC)

What do these parameters represent?
The peak is the maximum glucose value reached during the two hours following intake. In non-diabetic adults, values above 140 mg/dL represent a transient hyperglycemia, which typically subsides within the following minutes in most conventional situations.
Amplitude refers to the difference between the initial glucose value and the maximum value reached. Thus, it not only measures the highest value achieved (peak) but also considers the starting point and the relative rise in blood glucose concentration following intake. The combination of peak and amplitude indicates the initial impact of the intake.
Stabilization shows how glucose values recover in the two hours following intake, meaning how far glucose levels are from the preprandial (before intake) glucose.
- Values close to 0 indicate that the glycemic impact of the intake has been stabilized.
- Values that are significantly positive may indicate a need for more time to stabilize blood glucose.
- Negative values may suggest the presence of reactive hypoglycemia, which often occurs when there is a high intake of carbohydrates and consequently, a high insulin secretion to restore normal glucose levels.
Finally, AUC (Area Under the Curve) aims to show the rise in blood glucose concentration over the two hours following intake. It represents the area under the glucose curve. A larger area (higher AUC) indicates a longer period of elevated glucose levels compared to the pre-ingestive value, and consequently, more time needed for the body to stabilize these levels.
Interpretation of the Glucoscore
To interpret the Glucoscore, there are two types of information sources available. On one hand, there are the four objective parameters mentioned earlier: peak, amplitude, stabilization, and AUC. In the app, these parameters are displayed on a scale from 1 to 10 and serve as a guide to analyze specific aspects of the impact of your meals.
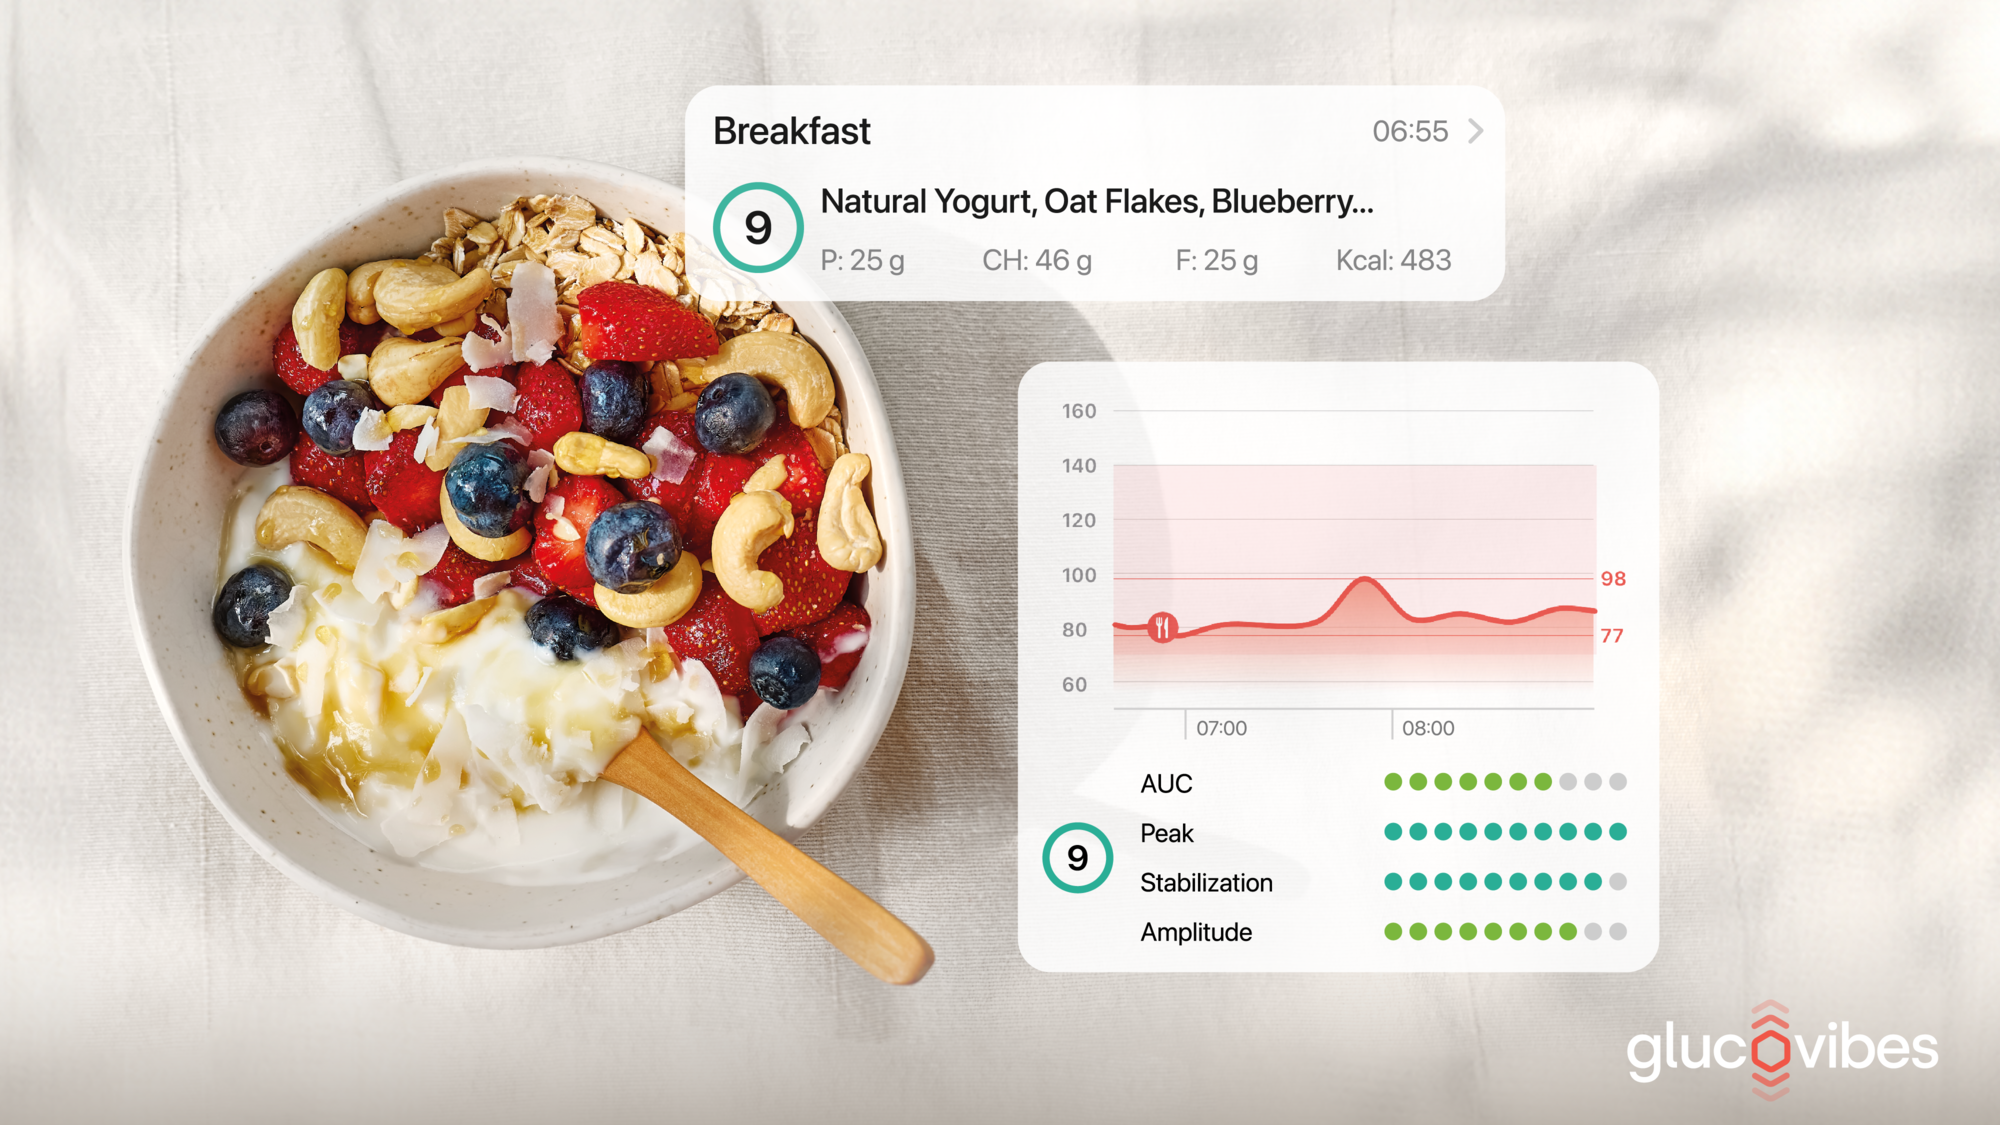
On the other hand, there is the overall rating of the intake, which could be considered the general score or summary impact. This general score takes into account all the glucose points that make up your curve, compares them with all the curves in the Glucovibes database, and is informed by the knowledge that our team has integrated into the artificial intelligence algorithms. As a result, each of your meals can be evaluated uniquely and comprehensively, receiving a rating based on how the meal affects the evolution of glucose concentration in your bloodstream. This allows us to provide you with a personalized metric based on the shape and progression of your glucose curve after a meal.
Glucose prediction
With all this information, we’ve continued working to offer you a prediction of your glucose curve without the need for monitoring sensors.
This feature is designed for people without metabolic conditions, significant insulin resistance, diabetes, or similar issues.
Our algorithms have identified how thousands of people wearing sensors respond to different foods. Using that data, we can predict the change in your glucose as a curve based on what you eat—no sensor required. In other words, we can forecast your glucose levels.
We achieve around 80% accuracy, as we filtered certain data during algorithm training to exclude individuals above and below the ranges that represent roughly 80% of all VIBERs.
Here’s an example:
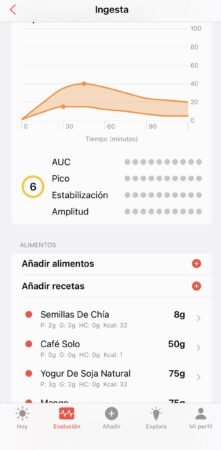
When you enter your meal or intake details in the app, Glucovibes calculates in real time the predicted glucose curve, providing a confidence interval where your glucose levels are expected to fall over the next 2 hours.
This represents the rise in glucose (mg/dl) you may experience in the next 120 minutes, which, as you can see, is shown between two thresholds—one lower and one higher—reflecting the typical response of roughly 80% of people who have used Glucovibes with a sensor.
This prediction does not account for physical activity, so if you go for a walk afterward or have exercised beforehand, you will likely be closer to the lower range, or even below it. We’ve designed the tool this way so you can simulate the impact of any meal on your glucose, and if you notice a high predicted peak or a projected GlucoScore below 6, for example, you can decide to take a walk to help your metabolism.
If you have any questions, you can always email us at info@glucovibes.com